
Blood Sugar Level Chart: Understand and Manage Your Glucose Levels
What is a Normal Blood Sugar Level?
Maintaining healthy blood sugar levels is crucial for overall well-being. The values vary based on age, meal timings, and medical conditions.
Blood Sugar Levels for Different Conditions
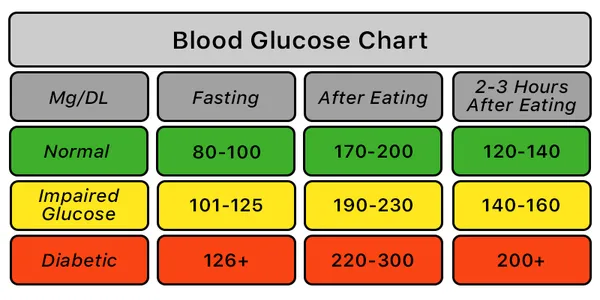
- Fasting Blood Sugar: 70-99 mg/dL (Normal)
- After Meal (Postprandial): Less than 140 mg/dL (Normal)
- Diabetes Diagnosis:
-
- Fasting: 126 mg/dL or higher
- Post Meal: 200 mg/dL or higher
Blood Sugar Levels Chart by Age
| Age Group | Fasting (mg/dL) | After Meal (mg/dL) |
| Children (Below 6 years) | 80-100 | Less than 140 |
| Adults (18-60 years) | 70-99 | Less than 140 |
| Seniors (Above 60 years) | 80-110 | Less than 150 |
Blood Sugar Levels Chart For Diabetics vs. Non-Diabetics
| Condition | Fasting (mg/dL) | After Meal (mg/dL) |
| Non-Diabetic | 70-99 | Less than 140 |
| Prediabetes | 100-125 | 140-199 |
| Diabetes | 126 or higher | 200 or higher |
Blood Sugar Levels Chart for Women
Women may experience fluctuations in blood sugar due to hormonal changes. The following levels serve as a guideline:
- Normal Range: 70-99 mg/dL (fasting), less than 140 mg/dL (after meals)
- During Pregnancy (Gestational Diabetes Risk): 95 mg/dL or lower (fasting), 140 mg/dL or lower (after meals)
Factors Affecting Blood Sugar Levels
Several factors influence glucose levels, including:
- Diet: High-sugar foods cause spikes.
- Physical Activity: Regular exercise improves insulin sensitivity.
- Medications: Insulin and other drugs regulate blood sugar.
- Stress Levels: Chronic stress leads to fluctuations.
How to Monitor Blood Sugar Levels
Monitoring your blood sugar is essential for diabetes management. Follow these steps:
- Use a glucose meter to check levels at different times.
- Maintain a diary to track readings and diet.
- Consult your doctor for any irregular patterns.
Printable Blood Sugar Chart
A printable blood sugar chart can help track glucose levels daily. Download a printable blood sugar chart here to maintain a record.
Tips for Maintaining Healthy Blood Sugar Levels
- Eat a balanced diet rich in fiber and protein.
- Exercise regularly for at least 30 minutes daily.
- Stay hydrated and limit sugary beverages.
- Get adequate sleep to regulate hormones.
- Manage stress through meditation and relaxation techniques.
Frequently Asked Questions
What is the ideal blood sugar level for diabetics?
For diabetics, fasting blood sugar should be between 80-130 mg/dL and after meals less than 180 mg/dL.
Can stress affect blood sugar levels?
Yes, chronic stress releases hormones like cortisol, raising blood sugar levels.
How often should I check my blood sugar?
If you have diabetes, checking before meals and at bedtime is ideal. Consult your doctor for personalized advice.
How do blood sugar levels differ for seniors?
Seniors may have slightly higher normal blood sugar levels, often ranging from 80-110 mg/dL (fasting) and less than 150 mg/dL (after meals).
Are blood sugar levels different for men and women?
While standard blood sugar levels are similar, hormonal fluctuations in women, especially during pregnancy or menopause, can impact glucose levels.
Conclusion
Understanding blood sugar levels is key to managing health effectively. Use this chart as a reference and take proactive steps to maintain optimal glucose levels.
Immunity Boosting Foods: A Vital Addition to Your Diet
Incorporating immunity boosting foods into your diet is essential for maintaining optimal health. These foods, rich in vitamins, minerals, and antioxidants, help strengthen your immune system and protect against illnesses. Key examples include citrus fruits like oranges and grapefruits, which are high in vitamin C, and garlic, known for its antimicrobial properties. Leafy greens, such as spinach and kale, provide essential nutrients that support immune function. Additionally, nuts and seeds offer healthy fats and vitamin E, crucial for immune health. By adding a variety of these immunity boosting foods to your meals, you can enhance your body’s natural defenses.
Left Side Stomach Pain: Causes and Considerations
Left side stomach pain can be a concerning symptom, with various potential causes. This discomfort might originate from digestive issues, such as gastritis or a peptic ulcer, or could indicate problems with the spleen or pancreas. It may also be related to issues like diverticulitis or even ovarian cysts in women. Understanding the underlying cause of left side stomach pain is crucial for effective treatment. If the pain is persistent or severe, seeking medical advice is essential to diagnose and address the root cause. Proper evaluation and management can help alleviate discomfort and prevent further complications.